Why your £100 goes three times further in Indonesia than at home
StreetOwl's holiday value scores show a gap from 93/100 down to 7/100 between the best and worst destinations. The exchange rate is only half the story – local prices do the rest.
The 93/100 score: what it actually measures
The value score combines exchange rate movements with local cost of living to give a fuller picture of purchasing power. Neither factor alone tells the whole story, as a favourable rate in an expensive country can still mean high daily costs. This blend highlights where your money actually stretches further than the rate suggests.
Looking at a £100 spending basket, the differences are stark. In Indonesia, that amount covers what would cost a fraction of the domestic price. In the US, the same goods cost slightly more than half the home value, while in Israel the price rises significantly. Iceland is the most expensive, where that basket costs the most. This gap is driven as much by local prices as by the exchange rate itself.
StreetOwl uses ECB and World Bank data, with the latest update published on 9 October 2026. These scores are a snapshot that shifts as markets move. The top score of 93/100 for Indonesia reflects strong value, while lower scores show where budgets work harder.
Where the pound stretches most right now
The top four destinations score 91/100, 90/100, and 85/100, alongside the 93/100 leader. In all these places, the local cost for a £100 basket falls below £35. This combination makes them the strongest stretches of the pound available right now. You are benefiting from genuinely lower local prices for food, transport, and services, not just a good exchange rate.
The rate tailwind is significant in some markets. Indonesia’s rate is 6.8% better than a year ago, better than in 98% of months since 1999. India’s rate is 7.7% better, its best since at least 2000. Even where rate movement is modest, the local price effect remains visible.
Contrast this with mid-tier options. The Euro area scores 67/100, where £100 costs about £73. Canada scores 56/100, with the same basket costing about £93. These figures show that a stable rate does not make sure good value if local prices are high. Great value here means the same daily expenses cost less once converted, reflecting a true increase in purchasing power.
The hidden costs that eat into the saving
Fixed costs like mobile roaming, eSIM data packs, and daily insurance premiums do not scale with local prices. This makes them proportionally heavier on a budget trip than a mid-range one, potentially eroding the savings a high value score suggests. The impact varies by trip length and data plan, but these steady pound costs remain constant regardless of how cheap the destination is.
Exchange rate conditions are not static. Indonesia’s rate is currently better than in 98% of months since 1999, but this is a moving number. Rates can reverse as quickly as they improve, and accommodation priced in local currency may not adjust one-for-one. Timing a booking during a favourable stretch can save more than switching providers, but do not assume this advantage is permanent.
Treat connectivity as a separate line item in your holiday budget. Isolating data charges prevents low local prices from being quietly absorbed by roaming fees. This ensures your final costs reflect true local value rather than hidden UK-based expenses.
Worked example: one day's spending, three destinations
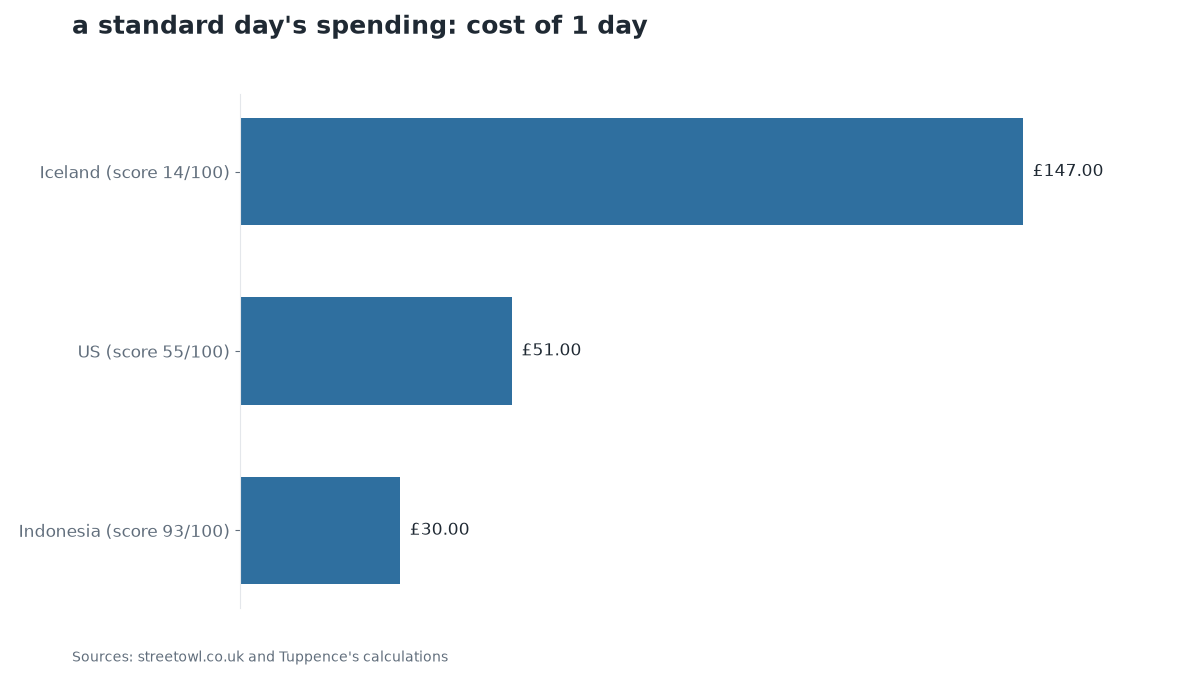
Consider a typical day’s spending basket covering food, transport, and a small activity. This costs £100 in the UK, but local prices shift its value significantly. In the top-scoring destination, the same basket costs £30. In the US, with a score of 55/100, it costs £51. In Iceland, scoring 14/100, the price rises to £147.
The difference between the highest and lowest costs is £117, meaning Iceland is 390% more expensive than the top destination for the same routine. With £100, you get roughly three days’ worth of this basket in the top-scoring location. In the US, that amount covers just under two days. In Iceland, it barely lasts ten hours. This highlights that local prices, not just the exchange rate, determine how far your money truly stretches.
What to do before you book
Check StreetOwl’s 9 October 2026 score for your destination to gauge the rate’s current position. Then, budget connectivity separately. Look up eSIM or local SIM costs and add them to your daily spend estimate before comparing to a UK baseline, as these fixed costs do not scale with local prices.
Note the rate’s direction. Indonesia’s 6.8% and India’s 7.7% year-on-year improvements suggest the window is open now, but rates can reverse quickly. Recheck the rate a week or two before flying, as a small move can shift a value score from great to fair. This helps budget-conscious families, solo travellers, and anyone on long-haul trips where daily spend adds up over ten-plus days.
- days away: 1 day
- Check the latest holiday value score for your destination on StreetOwl's 9 October 2026 page (or the next monthly update).
- Work out your daily spend budget in UK pounds, then divide by the local-equivalent cost shown in the score to see how many days' worth of local life your money covers.
- Price an eSIM or local SIM for the destination and add it to your daily budget as a fixed cost, separate from food and transport.
- Note the year-on-year exchange-rate change for your currency (Indonesia +6.8%, India +7.7%) and recheck the rate a week before you fly.
- If you are comparing two destinations, do the same £100-basket calculation for both and compare the number of days each covers before adding flights and accommodation.
Sources
This digest was drafted by StreetOwl’s own model from published figures and the sources listed, then read and approved by Michael Rossi on 12 October 2026 before it went up. It is general information, not financial advice: your circumstances are yours, and for a decision that matters, MoneyHelper (free, government-backed) or a regulated adviser is the place to go. General information, not personal financial advice. Figures checked on the dates shown.
← Back to StreetOwl