The inflation tax on your savings: what 3.5% really costs you
Your instant-access account is earning less than prices are rising, so your money is quietly buying less each year. Here is the gap, the decade-scale effect, and how to check if you are paying it.
The gap you do not see on your statement
In September 2026, CPI inflation stood at 3.5%. Meanwhile, the average instant-access rate including bonuses was 2.06%, dropping to 1.9% when introductory offers are excluded. However, the effective rate households actually received on instant-access deposits was only 1.65%. This means the real gap between what you earn and what prices cost is wider than the advertised figures suggest. You might see a positive interest credit on your statement, but because your account rate is below the inflation rate, your balance grows in pounds yet buys less each year. This difference acts as an invisible cost on your savings.
It is worth noting that RPI, which remains relevant for regulated rail fares and student-loan interest, was higher at 3.9%. This indicates that the price rise you feel on specific bills may be steeper than the CPI headline. While these figures paint a clear picture of current purchasing power, inflation is a trailing measure and can fall. Therefore, the gap is not certain to persist. Still, for now, the quiet erosion of your savings’ real value is a reality worth checking against your own bank’s actual payout.
A decade of small losses compounds
The Office for National Statistics records that the Consumer Price Index for all items rose 37.4% between 2016 and 2025. In the same period, the cost of food and non-alcoholic beverages climbed by 45%. While average regular pay increased by 46.3% in cash terms, keeping pace with these price rises, savings accounts earning below inflation fell further behind. This illustrates a key principle of compounding losses. When you hold cash in an account earning less than inflation, the purchasing-power loss compounds over time. Each year, you begin from a smaller real base, meaning the gap between your savings and the cost of living widens progressively. This is not a prediction, but a description of what occurred over that specific ten-year window. It serves as a reminder that the arithmetic of compounding works in both directions. However, this outcome assumes your account rate remained below inflation for the entire duration. If inflation had fallen or your rate had risen, the gap would have narrowed or closed. The data highlights how small annual shortfalls accumulate into a significant reduction in what your money can buy, even if your nominal balance appears stable.
Worked example: £10,000 after one year
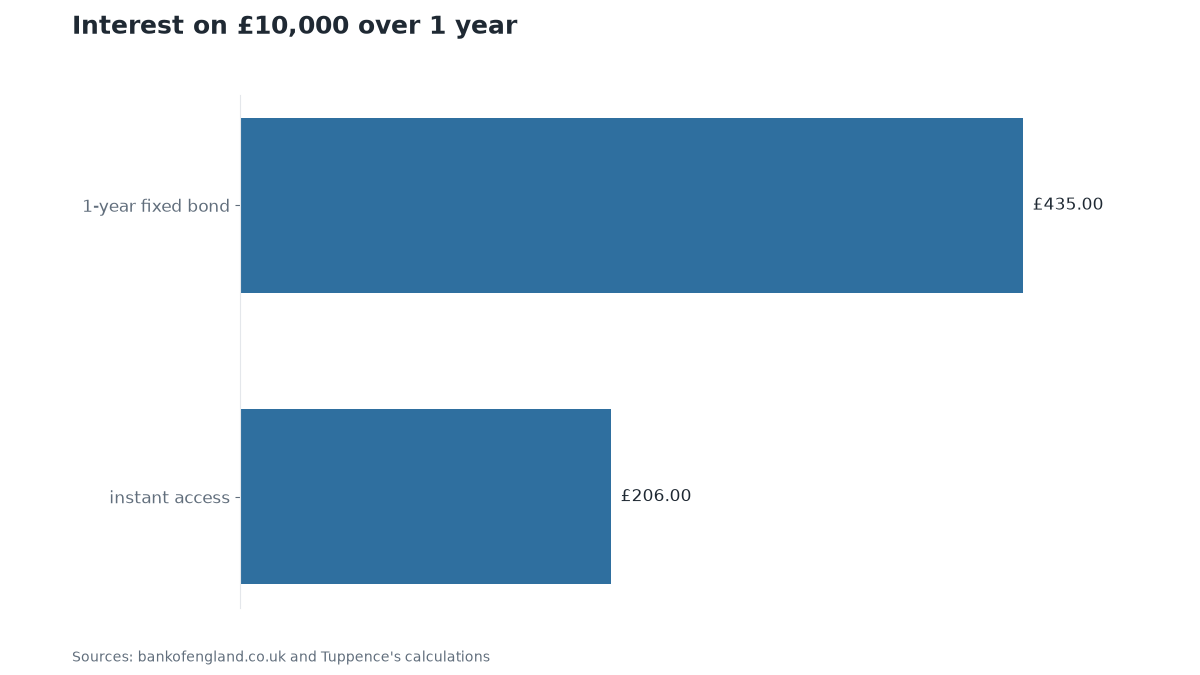
For a household keeping £10,000 in savings for 1 year, the difference in product choice is tangible. If you hold that amount in an instant-access account earning the average rate of 2.06%, you will see £206 added to your balance before tax. While this looks like a gain, it is less than the 3.5% rise in prices. Consequently, your money still buys less at the end of the year than it did at the start.
By contrast, locking the same £10,000 in a 1-year fixed bond earning the average rate of 4.35% generates £435 in interest before tax. This return exceeds the inflation rate, meaning your purchasing power actually increases. The gap between these two outcomes is £229, which is the extra amount you earn by committing your funds for 1 year rather than keeping them accessible.
This example highlights a simple trade-off. You gain liquidity with instant access, but you pay for it in real terms when inflation outpaces your interest. If you do not need that money for emergencies, the fixed option secures a higher return. Check your specific rates, as these are market averages, and consider how much of your savings you can comfortably lock away to close that gap.
How to check whether you are paying the tax
Check the rate on your current instant-access or current account against the inflation figure cited earlier. If it is lower, you are paying the tax every month. Note that the effective rate of 1.65% is often well below the advertised average of 2.06%, so your personal gap may be wider than headlines suggest.
If you have a surplus you will not need for at least one year, the one-year fixed bond averages 4.35% and the one-year fixed cash ISA averages 4.56%. For longer horizons, the two-year fixed bond averages 4.5% and the three-year fixed bond averages 4.56%. The two-year fixed cash ISA averages 4.53%. Each is a separate product with its own rate.
Keeping a small accessible buffer for emergencies and parking the longer-term surplus in a fixed term that matches your spending horizon is a common way to balance liquidity against the inflation gap. Fixed terms carry early-withdrawal penalties or loss of interest if you need the money back before the term ends. The right split depends on your personal cash-flow needs. This is general information, not personal advice; the correct split depends on your own circumstances.
- savings pot: £10,000
- holding period: 1 years
- Open your banking app and note the exact interest rate on your instant-access or current account, then compare it to the 3.5% CPI figure to see whether you are below the inflation line.
- Work out how much of your savings you genuinely will not need for at least one year; that is the amount that could move to a fixed term without penalty risk.
- Compare the one-year fixed bond (4.35%) and one-year fixed cash ISA (4.56%) to decide which product suits you, keeping in mind the ISA has a tax advantage but a lower annual allowance.
- Leave a small accessible buffer in instant access for unexpected expenses so you never have to break a fixed term early.
- Set a calendar reminder for the end of each fixed term so you can re-shop the rate before it reverts to a lower variable rate.
- Re-check your split whenever your spending plans change or when the next inflation figure is published, because the gap between your rate and prices can shift in either direction.
Sources
- Prices: CPI inflation, twelve-month rate, Sep 2026 (ONS D7G7, via StreetOwl)
- What savings pay: Instant-access savings account (including introductory bonuses), Sep 2026 (Bank of England IUMB6VJ, via StreetOwl)
- What savings pay: Instant-access savings account (excluding introductory bonuses), Sep 2026 (Bank of England IUMB6VK, via StreetOwl)
- Borrowing and saving, as it happened: Effective interest rate paid on households' instant-access deposits, Sep 2026 (Bank of England CFMHSCV, via StreetOwl)
- Prices: RPI inflation, twelve-month rate, Sep 2026 (ONS CZBH, via StreetOwl)
- Inflation & interest rates & you: CPI INDEX 00: ALL ITEMS 2015=100, change 2016 to 2025, 2016 to 2025 (Office for National Statistics, via StreetOwl)
- What savings pay: 1-year fixed-rate savings bond, Sep 2026 (Bank of England IUMWTFA, via StreetOwl)
- What savings pay: 2-year fixed-rate savings bond, Sep 2026 (Bank of England IUMB6RH, via StreetOwl)
- What savings pay: 3-year fixed-rate savings bond, Sep 2026 (Bank of England IUMB6RI, via StreetOwl)
- What savings pay: 1-year fixed-rate cash ISA, Sep 2026 (Bank of England IUMB6VN, via StreetOwl)
- What savings pay: 2-year fixed-rate cash ISA, Sep 2026 (Bank of England IUMZID2, via StreetOwl)
This digest was drafted by StreetOwl’s own model from published figures and the sources listed, then read and approved by Michael Rossi on 2 November 2026 before it went up. It is general information, not financial advice: your circumstances are yours, and for a decision that matters, MoneyHelper (free, government-backed) or a regulated adviser is the place to go. General information, not personal financial advice. Figures checked on the dates shown.
← Back to StreetOwl