The hidden cost of your energy supplier: reading the complaint data
Ofgem's Q2 2026 figures show a 196-fold gap between the best and worst suppliers. That gap may cost more in stress and admin than a few pence on your unit rate.
A 196-fold gap in complaint rates
Ofgem’s Q2 2026 data shows a significant gap in complaint rates across the 16 suppliers. The market average stands at 936 complaints per 100,000 customer accounts, down 11% on a year earlier. At the bottom, Outfox Energy reported just 10 per 100,000, while Utility Warehouse topped the list with 1,965. This stark contrast highlights how much your choice of supplier can impact your experience.
Mid-table providers like Utilita (946) and British Gas (957) sit slightly above the average. In contrast, Octopus Energy (476) and Ecotricity (270) are well below it. A complaint rate per 100,000 accounts is a rough proxy for how often a supplier’s billing, metering, or customer-service systems will generate a problem. Essentially, a higher rate suggests a greater likelihood that you will need to raise and chase an issue rather than having it resolved automatically.
What a complaint actually costs you in time and risk
This penalty, however, does not cover the true cost to you. A billing dispute or unauthorised meter swap often means weeks of phone calls, missed work, and a loss of heating. These disruptions can trigger a debt spiral or a mark on your credit file, impacts that never appear on a tariff comparison page.
The supplier pays a regulatory fine, but you absorb the practical consequences. This creates an asymmetry in risk that standard market data ignores. The time, stress, and potential credit impact of resolving a supplier error are real costs. No unit-rate comparison captures these hidden burdens, yet they determine your actual experience. The financial penalty paid by the company does not compensate for the disruption you face, highlighting a gap between regulatory accountability and consumer reality.
Where your supplier sits in the full ranking
To place your supplier in context, consider the full ranking of the 16 providers. Outfox Energy sits at the bottom with 10 complaints per 100,000 accounts, followed by Fuse Energy at 30 and Green Energy UK at 90. E reports 130, while Ecotricity records 270. Moving up, Octopus Energy stands at 476 and E.On at 760. Good Energy reports 870, with Utilita close behind at 946. British Gas logs 957 and EDF 966. Scottish Power reaches 1,397, So Energy 1,474, and Tru Energy 1,580. OVO reports 1,774, with Utility Warehouse at the top with 1,965.
Remember this metric is a proportion, not an absolute count. A small supplier with a low number of complaints and a small customer base can carry the same rate as a large one with more complaints and a much larger base. Therefore, a lower rate does not make sure a problem-free experience. However, it suggests fewer recurring failure points in the supplier’s billing or metering systems, which may mean less administrative stress for you.
Worked example: the financial stakes behind a billing error
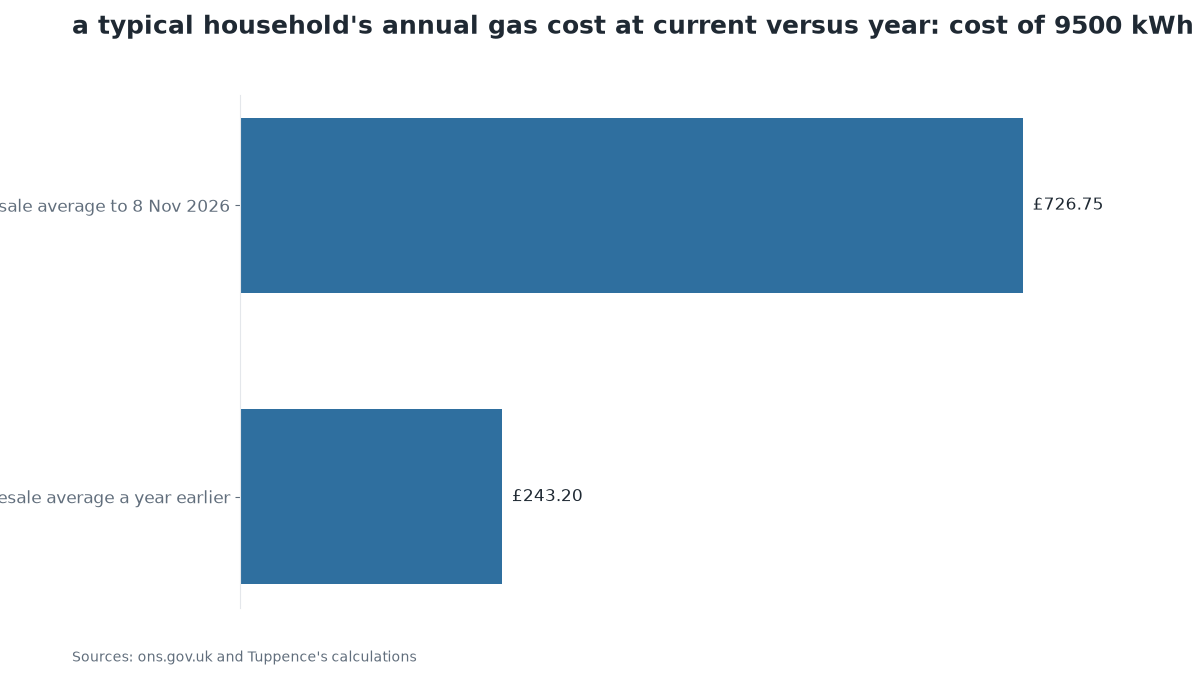
For a household using 9500 kWh of gas a year, the wholesale component of your bill is sensitive to price swings. In the seven days to 8 November 2026, the average was 7.65p per kWh, costing £726.75 annually. A year earlier, the average was 2.56p per kWh, which would have cost £243.20. The difference is £483.55, meaning the current average costs 198.83% more.
This gap represents a tangible financial stake. If your supplier issues a disputed invoice or performs an unauthorised meter change, you are facing a potential liability on a bill that has already increased by several hundred pounds year on year. A single billing error on a sum of this size creates a real risk of overpayment. Before you consider the stress of phone calls or the time spent on admin, the sheer value at stake is significant. The financial exposure is direct and immediate, making accurate billing a critical part of your household budget.
What to do: a practical checklist
Before switching, look up the supplier’s complaint rate for the latest two quarters on Ofgem’s website. Compare it to the market average figure previously noted. Once switched, set a monthly reminder to read your meter and check the bill matches within a few days, so a billing error is caught early.
If a prepayment meter is installed without your written consent, send a dated letter to the supplier and a copy to Ofgem, and keep a log of every call and email. This is the most common serious failure. If the supplier does not resolve the issue, submit a free complaint to the Energy Ombudsman with your log and any correspondence.
Checking complaint rates before switching and monitoring your account are low-effort steps that can reduce the chance of catching a billing error late. This matters most to households with limited spare time, a thin credit buffer, or existing payment difficulties, because the consequences of a supplier error compound.
- annual gas usage: 9,500 kWh
- Before you switch, look up the supplier's complaint rate for the latest two quarters on Ofgem's website and compare it to the 936-per-100,000 market average
- Once you have switched, set a monthly phone reminder to read your meter and check the bill matches within a few days
- If a prepayment meter is installed without your written consent, send a dated letter to the supplier and a copy to Ofgem, and keep a log of every phone call with the date, time, and the name of the person you spoke to
- If the supplier does not resolve the issue, submit a free complaint to the Energy Ombudsman with your log and any correspondence
- Review the complaint-rate data again before your next renewal or if you are considering switching again
Sources
- Gas to energy bill: Wholesale gas, Great Britain, seven-day average, seven days to 8 November 2026 (Office for National Statistics (source: National Gas Transmission), via StreetOwl)
- Gas to energy bill: What 1p a kWh on wholesale gas is worth a year, seven days to 8 November 2026 (StreetOwl arithmetic, via StreetOwl)
- Which energy supplier gets the most complaints: Energy supplier complaints per 100,000 customer accounts, whole market, Q2 2026 (Ofgem (suppliers' own figures), via StreetOwl)
- Which energy supplier gets the most complaints: Agreed by suppliers in Ofgem cases listed on the tile, May 2025 to 2026-10-14 (Ofgem, via StreetOwl)
- 2-year fixed mortgage, 60% loan-to-value (StreetOwl)
- 2-year fixed mortgage, 75% loan-to-value (StreetOwl)
- 2-year fixed mortgage, 85% loan-to-value (StreetOwl)
This digest was drafted by StreetOwl’s own model from published figures and the sources listed, then read and approved by Michael Rossi on 20 November 2026 before it went up. It is general information, not financial advice: your circumstances are yours, and for a decision that matters, MoneyHelper (free, government-backed) or a regulated adviser is the place to go. General information, not personal financial advice. Figures checked on the dates shown.
← Back to StreetOwl