Diesel or petrol: the pump-price gap that changes the maths
The median diesel pump price is 199.9p a litre versus 174.9p for petrol as of 6 October 2026. That gap changes the mileage at which diesel's efficiency edge pays off.
The pump-price gap on 6 October 2026
As of 6 October 2026, the national median pump price for petrol (E10) stands at 174.9p a litre. On the same day, the median price for diesel is 199.9p a litre. These figures are drawn from the retailer open-data feed, which covers 8,075 forecourts, meaning roughly half of all pumps are cheaper than these medians. The difference between the two fuels is 25.0p per litre.
This premium matters because diesel engines generally use fewer litres per mile than petrol engines of similar size. However, this efficiency edge varies by model and driving conditions, so it is not certain in every scenario. The wider the per-litre premium, the more miles you need to drive to claw back that advantage. If you are considering a diesel vehicle, this 25.0p gap changes the mileage at which the maths works in your favour.
Why the break-even point moves
Diesel engines typically use fewer litres per mile than petrol units of similar size, but this advantage varies by model and driving conditions. It is a design characteristic, not a certain outcome in every scenario, so there is no single universal break-even mileage. The threshold where diesel’s efficiency offsets its higher cost depends on the specific mpg figures of the cars you are comparing and your annual mileage.
To assess this accurately, use the combined mpg figure rather than the "up to" headline found in advertisements. The combined metric better reflects mixed real-world driving, while the headline figure represents idealised conditions. Your real-world mpg will shift with load, speed, and driving style. These variables mean the break-even point is unique to your specific vehicle and how you use it.
Worked example: a year's fuel at today's median prices
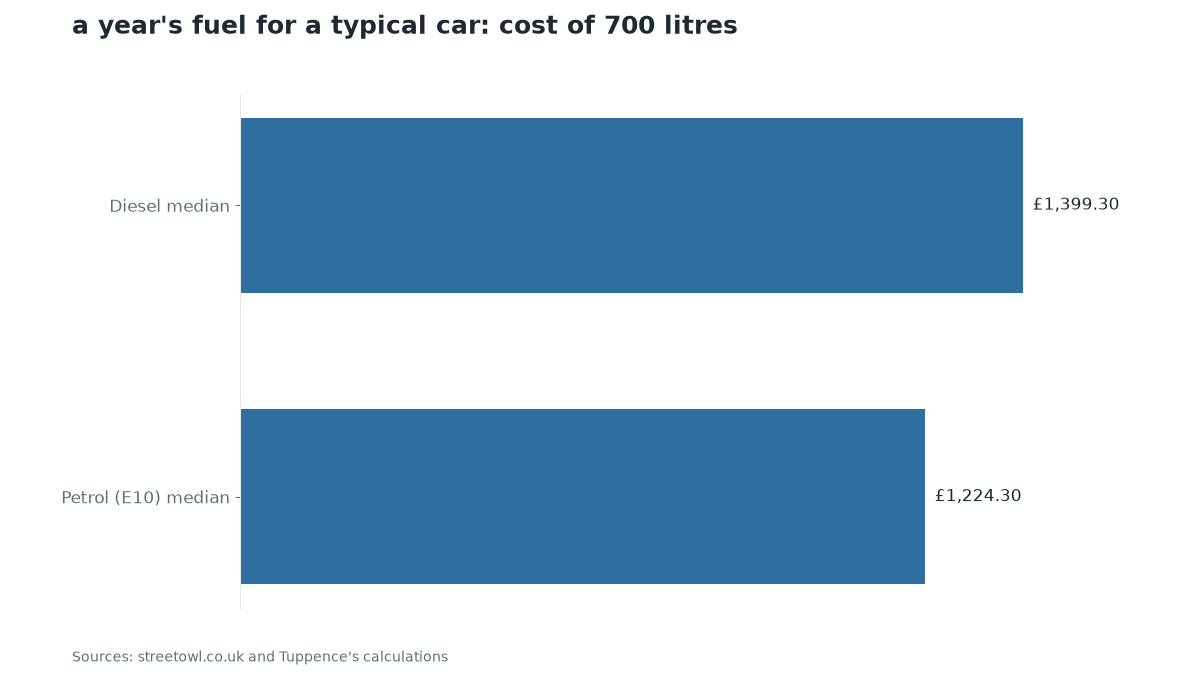
Assume a typical car uses 700 litres of fuel in a year. At the median price of 174.9p a litre, that volume costs £1,224.30 in petrol. The same 700 litres of diesel, at 199.9p a litre, costs £1,399.30. This £175 difference shows diesel is 14.29% more expensive per litre.
However, a diesel car would actually use fewer than 700 litres due to better fuel economy. This example isolates the price gap; your real saving depends on the specific mpg figures of the models you compare. There is no universal break-even point, as efficiency varies by vehicle and driving conditions.
To find your true cost, substitute your own annual mileage and the combined mpg of the two cars you are considering. Use these median prices as a starting point. Remember that fuel is only part of the total running cost, so your individual circumstances will determine the final outcome.
Fuel is only part of the running cost
Fuel alone does not tell the whole story of what a car costs to keep on the road. When you look at your total outlay, you must also account for insurance, vehicle excise duty and routine maintenance. These other line items vary significantly depending on the specific model, your location and how you drive. Consequently, a fuel-only comparison gives only part of the picture.
Because these expenses differ between vehicles, a small saving on fuel might be completely offset by higher costs elsewhere. Diesel-specific maintenance items and insurance premiums can be higher for some cars than for others. This means the apparent advantage of one fuel type can disappear once you include all recurring bills. To make a fair decision, you should add all these running costs to both columns before comparing them. The 25.0p per litre gap may look decisive on its own, but it can become much less significant when weighed against the rest of your annual budget.
Work it out for yourself
Check the combined mpg for both specific models, as this reflects mixed driving better than headline figures. Estimate your realistic annual mileage. Multiply litres-per-mile by the current median pump price for each fuel type. Add all recurring running costs, such as insurance, road tax and maintenance, to both columns. These other expenses vary by location and usage, so a small fuel saving might be offset by higher costs elsewhere. Recheck your figures if the pump-price gap shifts, since the break-even point moves with market changes.
This comparison helps most drivers weighing a purchase or switch, especially those whose annual mileage sits near the break-even point. High-mileage van drivers and fleet users should run the same maths with their own figures to determine the best value for their specific needs.
- fuel used in a year: 700 litres
- Check the combined mpg (not the 'up to' headline) for the exact petrol and diesel models you are comparing
- Work out your realistic annual mileage, including holidays and errands, not just the daily commute
- Multiply your litres-per-mile by the current median pump price for each fuel to get a cost-per-mile figure
- Add insurance, vehicle excise duty and maintenance to both columns before comparing
- Recheck the calculation if the petrol-diesel pump gap shifts by more than a few pence
Sources
This digest was drafted by StreetOwl’s own model from published figures and the sources listed, then read and approved by Michael Rossi on 7 October 2026 before it went up. It is general information, not financial advice: your circumstances are yours, and for a decision that matters, MoneyHelper (free, government-backed) or a regulated adviser is the place to go. General information, not personal financial advice. Figures checked on the dates shown.
← Back to StreetOwl